Abstract
Background: Population aging intensifies the public health challenge of malnutrition among the elderly, who face both undernutrition and overnutrition. The relationship between BMI and nutritional status in urban Chinese elderly remains underexplored. Objective: This study aimed to examine the association between Body Mass Index (BMI) and Mini-Nutritional Assessment Short-Form (MNA-SF) scores among community-dwelling elderly in Shanghai. Methods: A cross-sectional survey was conducted from January 2019 to January 2023, involving 106 elderly residents aged ≥60 years. Data on demographics, BMI, and MNA-SF scores were collected. Statistical analyses included descriptive statistics, Pearson correlation, and simple linear regression. Results: The mean age was 70.89 ± 6.56 years, with 75.5% females. Mean BMI was 22.85 ± 3.13 kg/m²; 30.2% were overweight and 7.5% underweight. The mean MNA-SF score was 12.23 ± 1.50, with 29.2% at risk of malnutrition. A significant positive correlation was found between BMI and nutritional score (r = 0.504, p < 0.001). Linear regression showed BMI positively predicted nutritional score (β = 0.243, p < 0.001), with the equation: Nutritional Score = 6.679 + 0.243 × BMI (R² = 0.254). Conclusion: BMI is positively associated with nutritional scores among Shanghai community-dwelling elderly. However, reliance solely on BMI may overlook hidden malnutrition risks in overweight individuals. Community health strategies should integrate comprehensive nutritional assessments for targeted interventions.
Keywords
Nutritional Status, Body Mass Index, MNA-SF, Elderly, Community Health
1. Introduction
Population aging represents one of the most significant social transformations of the 21st century. According to United Nations projections, the global population aged 60 years and over is expected to rise to 21.4% by 2050, marking the advent of a deeply aged society
. China, home to the world's largest elderly population, is experiencing an aging process characterized by both an unprecedented scale and an accelerated pace. Recent national statistics indicate that individuals aged 60 and over in China have surpassed 260 million, constituting 18.7% of the total population and underscoring a critical aging demographic
| [2] | WU H, WANG Y, ZHANG H, et al. An investigation into the health status of the elderly population in China and the obstacles to achieving healthy aging [J]. Scientific Reports, 2024, 14(1): 31123. https://doi.org/10.1038/s41598-024-82443-2 |
[2]
. In this context, promoting healthy aging and enhancing the overall health and quality of life for older adults have become central pillars of national public health strategy.
Nutritional status is a pivotal, modifiable determinant of health outcomes in later life. Adequate nutritional intake is essential for maintaining physiological function, delaying the progression of chronic diseases, and preserving independence in activities of daily living
| [3] | NORMAN K, HAß U, PIRLICH M. Malnutrition in Older Adults-Recent Advances and Remaining Challenges [J]. Nutrients, 2021, 13(8). https://doi.org/10.3390/nu13082764 |
| [4] | COSTA-PEREIRA J P, PRADO C M, GONZALEZ M C, et al. New insights on the use of mini nutritional assessment: Impact of alternative calf circumference cutoffs [J]. Clinical Nutrition, 2025, 48: 60-9. https://doi.org/10.1016/j.clnu.2025.03.015 |
[3, 4]
. However, the elderly are particularly vulnerable to nutritional inadequacies. Age-related physiological declines—such as in taste and smell, mastication and swallowing capacity, and digestive efficiency—coupled with psychosocial factors like social isolation, depression, and economic constraints, significantly increase the risk of undernutrition
| [5] | Chapter 5.3 Ensuring Good Nutrition for Vulnerable Population Groups suchas Elderly and Hospitalized Individuals in Affluent Societies [M]//KRAEMER K, CORDARO J B, FANZO J,l. Good Nutrition: Perspectives for the 21st Century. S. Karger AG. 2016: 0. https://doi.org/10.1159/000452391 |
[5]
. Concurrently, shifts in lifestyle and dietary patterns have led to the overconsumption of energy-dense, high-fat, and processed foods, contributing to a rising prevalence of overnutrition and associated non-communicable diseases, including obesity, diabetes, and cardiovascular conditions, among the elderly
| [6] | AMIRKALALI B, SHARIFI F, FAKHRZADEH H, et al. Evaluation of the Mini Nutritional Assessment in the elderly, Tehran, Iran [J]. Public Health Nutr, 2010, 13(9): 1373-9. https://doi.org/10.1017/S1368980010000303 |
| [7] | CAMINA-MARTíN M A, DE MATEO-SILLERAS B, MALAFARINA V, et al. Nutritional status assessment in geriatrics: Consensus declaration by the Spanish Society of Geriatrics and Gerontology Nutrition Work Group [J]. Maturitas, 2015, 81(3): 414-9. https://doi.org/10.1016/j.maturitas.2015.04.018 |
[6, 7]
. Consequently, this population grapples with a dual burden of malnutrition, encompassing both undernutrition and overnutrition, presenting a complex public health challenge.
The early identification and accurate assessment of nutritional risk are fundamental prerequisites for effective intervention. Among various screening tools, the Mini-Nutritional Assessment (MNA), particularly its short-form (MNA-SF), is widely recommended for use in both community and clinical settings due to its comprehensiveness, simplicity, and high specificity for the elderly
| [8] | DONINI L M, POGGIOGALLE E, MORRONE A, et al. Agreement between different versions of MNA [J]. J Nutr Health Aging, 2013, 17(4): 332-8. https://doi.org/10.1007/s12603-013-0005-z |
| [9] | ROBB L, WALSH C M, NEL M, et al. Malnutrition in the elderly residing in long-term care facilities: a cross sectional survey using the Mini Nutritional Assessment (MNA®) screening tool [J]. South African Journal of Clinical Nutrition, 2017, 30(2): 34-40. https://doi.org/10.1080/16070658.2016.1248062 |
[8, 9].
It facilitates a multidimensional evaluation encompassing anthropometric measures, dietary intake, global assessment, and subjective health perception. In contrast, Body Mass Index (BMI), while valuable as a simple, objective indicator of weight status and a preliminary screen for nutritional risk, possesses inherent limitations. It fails to differentiate between body fat and muscle mass and does not reflect dietary quality, thereby constraining its utility as a standalone tool for comprehensive nutritional assessment in older adults.
Shanghai, a quintessential Chinese megacity, presents a unique context for examining the nutritional health of community-dwelling older adults. Rapid urbanization, the nuclearization of family structures, and an increasing proportion of seniors living alone may profoundly influence nutritional status by altering food accessibility, meal preparation practices, and social support systems
| [10] | WANG W, SHEN J, LIN Q, et al. Nutritional status and its influencing factors of urban Chinese adults aged 40-69 years [J]. Asia Pac J Clin Nutr, 2025, 34(3): 397-410. https://doi.org/10.6133/apjcn.202506_34(3).0014 |
| [11] | TSANG J P Y, CHEUNG D S K, LIU J Y W. Social Factors, Dietary Intake and the Nutritional Status of Community-Dwelling Chinese Older Adults: A Scoping Review [J]. Nutrients, 2025, 17(12): 2019. https://doi.org/10.3390/nu17122019 |
[10, 11]
. While the relationship between BMI and nutritional status has been explored in various Western and some Asian cohorts, a distinct research gap persists specifically within the context of major urban centers in China. Existing studies in similar settings have often relied solely on BMI or focused predominantly on undernutrition, lacking integration with a comprehensive nutritional screening tool like the MNA. Furthermore, systematic evidence investigating the precise correlation between BMI and MNA-derived nutritional scores among the elderly in Shanghai's communities remains notably scarce. This gap is critical because the unique socio-cultural, economic, and environmental factors prevalent in a rapidly developing metropolis like Shanghai may modulate this relationship in ways not fully captured by studies from other regions.
Therefore, this study aims to bridge this gap by conducting a community-based, cross-sectional survey to rigorously analyze the association between BMI and MNA nutritional scores among elderly residents in Shanghai. We seek not only to quantify this relationship but also to elucidate its public health implications, thereby generating localized scientific evidence essential for optimizing targeted, community-based nutritional support strategies for China's aging urban population.
2. Materials and Methods
2.1. Study Design and Participants
This community-based, cross-sectional study was conducted between January 2019 and January 2023 in a typical urban community in Shanghai. A random sampling method was employed to recruit permanent elderly residents aged 60 years and above.
2.1.1. Sample Size Estimation
The sample size was determined a priori using G*Power software (version 3.1.9.7). Based on a preliminary pilot study, we anticipated a moderate correlation (ρ ≈ 0.3) between BMI and the MNA-SF score. For a Pearson correlation analysis, with a two-tailed significance level (α) of 0.05 and a desired statistical power (1-β) of 0.80, the minimum required sample size was calculated to be 84 participants. Accounting for a potential non-response or data incompleteness rate of 20%, we aimed to recruit at least 106 participants, which was deemed sufficient for the primary analysis.
2.1.2. Inclusion and Exclusion Criteria
The inclusion criteria were as follows: (1) age ≥ 60 years; (2) continuous residence in the target community for at least 6 months; (3) ability to perform basic Activities of Daily Living (ADLs) independently or with minimal assistance; (4) clear consciousness, with adequate communication and comprehension abilities to cooperate with the survey and physical measurements; and (5) provided informed consent voluntarily.
Participants were excluded if they met any of the following criteria: (1) presence of severe organic diseases (e.g., advanced heart failure, end-stage renal disease, severe chronic obstructive pulmonary disease) that substantially impair daily activities and metabolic status; (2) clinical diagnosis of severe cognitive impairment (e.g., moderate to severe dementia) or major mental illness; (3) undergoing active cancer treatment (e.g., chemotherapy, radiotherapy) or receiving palliative care; (4) severe visual or hearing impairment that precludes effective communication; (5) current hospitalization or residency in a long-term professional care facility; or (6) history of major surgery or an acute medical event within the past three months.
2.2. Data Collection
Data were collected through face-to-face interviews conducted by a team of uniformly trained investigators and community healthcare staff. And written informed consent was obtained from all participants prior to enrolment.
2.2.1. Anthropometric Measurements
Body weight and height were measured following standardized procedures. Participants were instructed to remove their shoes, heavy outer garments, and hats. Height was measured to the nearest 0.1 cm using a portable stadiometer, and body weight was measured to the nearest 0.1 kg using a calibrated electronic scale. Body Mass Index (BMI) was calculated as weight in kilograms divided by the square of height in meters (kg/m2).
2.2.2. Assessment of Nutritional Status
Nutritional status was assessed using the Mini-Nutritional Assessment Short-Form (MNA-SF), a well-validated screening tool specifically designed for the elderly. The Chinese version of the MNA-SF has been previously validated and demonstrated good reliability and cultural applicability in this population
| [12] | LIU H, JIAO J, ZHU M, et al. Nutritional Status According to the Short-Form Mini Nutritional Assessment (MNA-SF) and Clinical Characteristics as Predictors of Length of Stay, Mortality, and Readmissions Among Older Inpatients in China: A National Study [J]. Front Nutr, 2022, 9: 815578. https://doi.org/10.3389/fnut.2022.815578 |
[12]
.
The MNA-SF comprises six items: (1) decline in food intake over the past three months, (2) weight loss during the last three months, (3) mobility, (4) psychological stress or acute disease in the past three months, (5) neuropsychological problems (e.g., dementia or depression), and (6) body mass index (BMI; or calf circumference if BMI is unavailable). The total score ranges from 0 to 14. According to the standard classification, a score of 12 to 14 indicates a normal nutritional status, a score of 8 to 11 identifies individuals at risk of malnutrition, and a score of 0 to 7 signifies malnutrition.
2.3. Statistical Analysis
All statistical analyses were performed using IBM SPSS Statistics for Windows, Version 26.0 (Armonk, NY: IBM Corp). Continuous variables that were normally distributed are presented as mean ± standard deviation (SD), while categorical variables are summarized as frequencies and percentages (n, %).
The primary analysis involved assessing the relationship between BMI (independent variable) and the MNA-SF score (dependent variable). The normality of the data distribution for these key variables was confirmed using the Shapiro-Wilk test. A one-sample t-test was conducted to compare the mean MNA-SF score of the sample against the theoretical median value of 12 points to evaluate the overall nutritional risk profile of the community. Pearson's correlation coefficient (r) was computed to quantify the strength and direction of the linear association between BMI and the MNA-SF score. Furthermore, a simple linear regression analysis was performed to model the predictive relationship of BMI on the nutritional score, resulting in a regression equation. The coefficient of determination (R2) was reported to indicate the proportion of variance in the MNA-SF score explained by BMI. A two-tailed p-value of less than 0.05 was considered statistically significant for all tests.
3. Results
3.1. Participant Characteristics
A total of 106 elderly residents were enrolled in this study. The baseline characteristics of the participants are summarized in
Table 1. The cohort comprised 26 males (24.5%) and 80 females (75.5%), with an overall mean age of 70.89 ± 6.56 years, ranging from 60 to 89 years. Significant differences were observed between genders in height and weight (p < 0.001 for both), which are consistent with general physiological dimorphism. However, no statistically significant differences were found between males and females in terms of age (p > 0.05), BMI (p = 0.815), or nutritional score (p = 0.289). The mean BMI for the entire sample was 22.85 ± 3.13 kg/m
2.
Table 1. Resident Information Collected from the Questionnaire.
Item | Total | Male | Female | t | P |
Number | 106 | 26 (24.5%) | 80 (75.5%) | - | - |
Age (years) | 70.89 ± 6.56 | 72.23 ± 7.83 | 70.45 ± 6.08 | - | - |
Height (cm) | 161.19 ± 7.21 | 169.46 ± 5.96 | 158.50 ± 5.30 | 8.885 | 0.001 |
Weight (kg) | 59.58 ± 10.33 | 66.19 ± 8.14 | 57.43 ± 10.09 | 4.023 | 0.001 |
BMI (kg/m2) | 22.85 ± 3.13 | 22.97 ± 1.79 | 22.80 ± 3.46 | 0.235 | 0.815 |
Nutritional Score | 12.23 ± 1.50 | 12.5 ± 1.48 | 12.14 ± 1.51 | 1.066 | 0.289 |
3.2. Nutritional Status and Malnutrition Risk
3.2.1. Association Between BMI and Nutritional Score
The mean nutritional score of the residents surveyed in this study was 12.23 ± 1.50, with scores ranging from 9 to 14. According to the nutritional score standards, residents with a score below 12 were classified as being at risk of malnutrition. The results showed that 31 residents (29.2%) were potentially at risk of malnutrition. These residents might have problems with inadequate nutrient intake in their daily diet and require further attention. A one-sample t-test was performed on these scores, yielding a t-value of -6.588 and a p-value of less than 0.001. Furthermore, we calculated the 95% confidence interval for this simplified nutritional score result as (-0.38, -0.20). Since the upper limit of this confidence interval is less than 0, we can conclude that the elderly population in the community may be at risk of malnutrition.
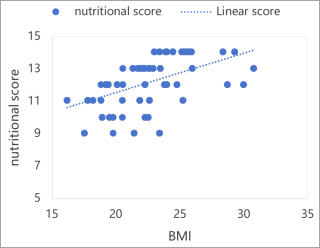
The correlation analysis between BMI and nutritional score indicated a significant positive correlation (r = 0.504, p < 0.001), suggesting that as BMI increases, the residents' nutritional scores also improve. This might reflect that residents with higher weight have more adequate nutrient intake, but it could also mean that some residents consume high-calorie, low-nutrient foods, leading to weight gain alongside an improvement in nutritional score. To further explore the predictive effect of BMI on nutritional score, a simple linear regression analysis was conducted. The results showed a regression coefficient of 0.243 (p < 0.001) for BMI predicting nutritional score, indicating that BMI has a significant predictive effect on the nutritional score. From the results of the linear regression parameter estimates, we can derive the regression equation between residents' BMI and nutritional questionnaire scores: the constant term is 6.679 (standard error = 0.940), the regression coefficient is 0.243, the t-value for testing the regression coefficient is 5.957, and the p-value is less than 0.001. This indicates a positive linear regression relationship between the residents' nutritional questionnaire scores and BMI. Therefore, we can conclude that: Nutritional Score = 0.243 * BMI + 6.679 (
Figure 1). The goodness-of-fit (R2) for the regression model was 0.254, indicating that BMI explains approximately 25.4% of the variation in nutritional scores. This means that BMI is an important predictor of residents' nutritional scores, but other unconsidered factors may also influence the nutritional score.
Figure 1. Scatter Plot Depicting the Relationship between BMI and Nutritional Score.
3.2.2. Malnutrition Risk Distribution Across BMI Categories
In this study, the risk of malnutrition was primarily concentrated in groups with lower BMI. Among underweight residents (BMI < 18.5), 7.5% (i.e., 8 people) were classified as at risk of malnutrition. Furthermore, 62.3% (i.e., 66 people) of residents with normal BMI showed potential risk of malnutrition, while this proportion was 30.2% (i.e., 32 people) in the overweight group. This indicates that individuals with low BMI are more likely to face problems of inadequate nutrient intake and require targeted nutritional interventions.
Table 2. Number of Residents by BMI Category.
BMI Category | Number of Residents |
Underweight (BMI: <18.5) | 8 |
Normal (BMI: 18.5-23.9) | 66 |
Overweight (BMI: ≥24) | 32 |
4. Discussion
With the accelerating progression of global population aging, nutritional issues among the elderly have ascended to become one of the core topics in the global public health domain. This challenge is particularly pronounced in developing countries, especially in China, which is undergoing rapid social transformation. China not only possesses the world's largest elderly population but also faces a unique national context characterized by an aging pace far exceeding that of developed countries at a comparable historical stage. Against this macro-background, in-depth investigation into the nutritional health status of the elderly and its influencing factors holds significant practical importance for advancing the strategy of healthy aging. This study focuses on Shanghai, a typical representative of China's modern metropolises, and by dissecting the complex relationship between BMI and nutritional scores among community-dwelling elderly, provides important scientific evidence for improving community-based health management for the aged.
The positive correlation between BMI and nutritional score revealed in this study (r=0.504, p<0.001) is consistent with findings from multiple domestic and international studies. Research by scholars like Arai et al.
similarly found that in elderly populations, a higher BMI is often associated with better nutritional screening scores. This phenomenon may reflect the intrinsic link between the adequacy of energy intake and nutritional scores. It is crucial to emphasize that complex physiological and social mechanisms underlie this correlation. From a physiological perspective, maintaining a relatively high body mass index requires sustained and adequate energy intake, which is precisely an important consideration in nutritional assessment. However, the substance beneath this surface-level observation warrants deeper reflection: does a higher BMI truly signify an ideal nutritional status? The answer is clearly negative.
The findings of this study highly align with the discoveries of M Zamboni et al.
, both suggesting that overweight and obesity in the elderly population are often accompanied by a decline in dietary quality. This phenomenon can be understood as a "nutrition paradox" – while energy intake is sufficient or even excessive, there may simultaneously be a deficiency in various micronutrients. This contradictory state is particularly prevalent among modern urban elderly populations, rooted in shifts in dietary patterns: increased intake of processed foods, the decline of traditional dietary patterns, and reduced dietary diversity, among others. Especially alarming is this study's finding that 30.2% of the overweight population still remains at risk of malnutrition. This figure highlights the severity of the "hidden hunger" problem.
From a global perspective, the results of this study resonate with the conclusions of Maria Besora-Moreno
| [15] | BESORA-MORENO M, LLAURADó E, TARRO L, et al. Social and Economic Factors and Malnutrition or the Risk of Malnutrition in the Elderly: A Systematic Review and Meta-Analysis of Observational Studies [J]. Nutrients, 2020, 12(3). https://doi.org/10.3390/nu12030737 |
[15]
regarding nutritional issues among the elderly in different cultural contexts. Characteristic features of the living environment in large metropolises – such as high rates of living alone, the weakening of traditional family support systems, and the prevalence of fast-food culture – collectively constitute special risk factors affecting the nutritional status of the elderly
| [16] | WU Y, WANG L, ZHU J, et al. Growing fast food consumption and obesity in Asia: Challenges and implications [J]. Social Science & Medicine, 2021, 269: 113601. https://doi.org/10.1016/j.socscimed.2020.113601 |
| [17] | POGGIOGALLE E, KIESSWETTER E, ROMANO M, et al. Psychosocial and cultural determinants of dietary intake in community-dwelling older adults: A Determinants of Diet and Physical Activity systematic literature review [J]. Nutrition, 2021, 85: 111131. https://doi.org/10.1016/j.nut.2020.111131 |
[16, 17]
. These influences are particularly significant in international cities like Shanghai. Due to factors like limited mobility, the digital divide, and economic constraints, the elderly face more obstacles in accessing nutritionally balanced meals, which partly explains why nutritional risks remain prevalent even among populations with high BMI.
A reasonable interpretation of the positive correlation between BMI and nutritional score requires analysis from multiple dimensions. On one hand, this correlation indeed reflects the adequate food intake necessary to maintain an appropriate weight, which manifests as better scores in nutritional assessment. On the other hand, we must be clearly aware that in the modern dietary environment, high energy-dense foods are often accompanied by low nutrient density. This means that the elderly might maintain their weight by consuming large quantities of refined carbohydrates, unhealthy fats, and added sugars, while their intake of essential nutrients such as vitamins, minerals, dietary fiber, and high-quality protein is relatively insufficient. This state of nutritional imbalance cannot be detected through BMI measurement alone and might even be masked by normal or overweight status, ultimately increasing the risk of metabolic diseases.
The public policy implications of this study's findings cannot be ignored. Firstly, it clearly indicates that the single indicator of BMI is no longer sufficient for comprehensively assessing the nutritional status of the elderly. In community health management practice, comprehensive nutritional assessment tools like the MNA should be promoted to more accurately identify populations at nutritional risk across different weight statuses. Secondly, a risk assessment-based hierarchical management strategy appears particularly important. Specifically, targeted intervention measures should be adopted for elderly populations with different risk characteristics: those with low BMI and malnutrition risk need enhanced energy and protein supplementation; whereas those with normal or high BMI and nutritional risk should focus on improving dietary quality and nutritional balance.
Data from the World Health Organization
| [18] | RYAN D, BARQUERA S, BARATA CAVALCANTI O, et al. The Global Pandemic of Overweight and Obesity [M]//KICKBUSCH I, GANTEN D, MOETI M. Handbook of Global Health. Cham; Springer International Publishing. 2021: 739-73. https://doi.org/10.1007/978-3-030-45009-0_39 |
[18]
corroborates the findings of this study. The continuous rise in overweight and obesity rates warns of the severity of the overnutrition problem. This trend is closely related to lifestyle changes such as the Westernization of dietary patterns and reduced physical activity. Therefore, community nutrition interventions must transcend the traditional concept of "weight management" and shift towards a new paradigm of "nutritional quality improvement." This includes promoting dietary patterns centered on whole grains, fresh fruits and vegetables, high-quality protein, and healthy fats, while limiting the intake of high-energy, low-nutrient-dense foods.
The limitations of this study point the way for future research. The inherent limitations of the cross-sectional design prevent us from inferring causality, and the single-center, small-sample characteristics also limit the generalizability of the findings. Future research should strive to: expand the sample size and research scope to include representative samples from more communities; adopt longitudinal designs to dynamically observe the changing patterns of nutritional status in the elderly; thoroughly investigate the influence of important confounding factors such as socioeconomic status, living arrangements, oral health, and mental health; and explore the development of nutritional assessment tools and intervention programs suitable for the characteristics of the Chinese elderly population.
5. Conclusion
This study addressed the relationship between BMI and nutritional status, as measured by the MNA-SF, among elderly residents in Shanghai communities. Our findings confirm a significant positive correlation between BMI and nutritional scores, indicating that higher BMI is generally associated with better nutritional assessment outcomes. However, this association is nuanced: while higher BMI may reflect adequate energy intake, it can also mask underlying nutritional imbalances, particularly in overweight individuals consuming energy-dense but nutrient-poor diets. The study highlights the limitation of using BMI as a standalone indicator for nutritional assessment in the elderly. It underscores the necessity of incorporating comprehensive tools like the MNA-SF in community health screenings to identify both undernutrition and overnutrition risks across different BMI categories.
Future research should expand to multi-center, longitudinal studies with larger and more diverse samples to validate these findings. Further investigation is also needed into the roles of socioeconomic factors, dietary patterns, oral health, and mental status in shaping nutritional outcomes. Developing culturally adapted nutritional assessment tools and tailored intervention strategies for China’s aging urban population is recommended.
Abbreviations
ADL | Activities of Daily Living |
BMI | Body Mass Index |
MNA | Mini-Nutritional Assessment |
MNA-SF | Mini-Nutritional Assessment Short-Form |
R² | Coefficient of Determination |
SD | Standard Deviation |
Funding
Medical-Industry Integration and Innovation Partnership Program of Shanghai Shenkang Hospital Development Center (SHDC2022CRT009).
Author Contributions
Zhui Ke: Conceptualization & Writing – original draft
Peng Ji: Formal analysis
Yini Zhao: Data curation & Formal analysis
Jingyi Lu: Investigation
Xinpei Luo: Investigation
Xuemin He: Data curation
Zhuqing Liu: Writing – review & editing
Min Yuan: Methodology & Writing – review & editing
Xianling Guo: Writing – review & editing
QingXu: Conceptualization, Funding, acquisition & Methodology
Conflict of Interest
All authors declare no conflicts of interest.
References
| [1] |
FREDRIKSEN GOLDSEN K, DE VRIES B. Global Aging With Pride: International Perspectives on LGBT Aging [J]. Int J Aging Hum Dev, 2019, 88(4): 315-24.
https://doi.org/10.1177/0091415019837648
|
| [2] |
WU H, WANG Y, ZHANG H, et al. An investigation into the health status of the elderly population in China and the obstacles to achieving healthy aging [J]. Scientific Reports, 2024, 14(1): 31123.
https://doi.org/10.1038/s41598-024-82443-2
|
| [3] |
NORMAN K, HAß U, PIRLICH M. Malnutrition in Older Adults-Recent Advances and Remaining Challenges [J]. Nutrients, 2021, 13(8).
https://doi.org/10.3390/nu13082764
|
| [4] |
COSTA-PEREIRA J P, PRADO C M, GONZALEZ M C, et al. New insights on the use of mini nutritional assessment: Impact of alternative calf circumference cutoffs [J]. Clinical Nutrition, 2025, 48: 60-9.
https://doi.org/10.1016/j.clnu.2025.03.015
|
| [5] |
Chapter 5.3 Ensuring Good Nutrition for Vulnerable Population Groups suchas Elderly and Hospitalized Individuals in Affluent Societies [M]//KRAEMER K, CORDARO J B, FANZO J,l. Good Nutrition: Perspectives for the 21st Century. S. Karger AG. 2016: 0.
https://doi.org/10.1159/000452391
|
| [6] |
AMIRKALALI B, SHARIFI F, FAKHRZADEH H, et al. Evaluation of the Mini Nutritional Assessment in the elderly, Tehran, Iran [J]. Public Health Nutr, 2010, 13(9): 1373-9.
https://doi.org/10.1017/S1368980010000303
|
| [7] |
CAMINA-MARTíN M A, DE MATEO-SILLERAS B, MALAFARINA V, et al. Nutritional status assessment in geriatrics: Consensus declaration by the Spanish Society of Geriatrics and Gerontology Nutrition Work Group [J]. Maturitas, 2015, 81(3): 414-9.
https://doi.org/10.1016/j.maturitas.2015.04.018
|
| [8] |
DONINI L M, POGGIOGALLE E, MORRONE A, et al. Agreement between different versions of MNA [J]. J Nutr Health Aging, 2013, 17(4): 332-8.
https://doi.org/10.1007/s12603-013-0005-z
|
| [9] |
ROBB L, WALSH C M, NEL M, et al. Malnutrition in the elderly residing in long-term care facilities: a cross sectional survey using the Mini Nutritional Assessment (MNA®) screening tool [J]. South African Journal of Clinical Nutrition, 2017, 30(2): 34-40.
https://doi.org/10.1080/16070658.2016.1248062
|
| [10] |
WANG W, SHEN J, LIN Q, et al. Nutritional status and its influencing factors of urban Chinese adults aged 40-69 years [J]. Asia Pac J Clin Nutr, 2025, 34(3): 397-410.
https://doi.org/10.6133/apjcn.202506_34(3).0014
|
| [11] |
TSANG J P Y, CHEUNG D S K, LIU J Y W. Social Factors, Dietary Intake and the Nutritional Status of Community-Dwelling Chinese Older Adults: A Scoping Review [J]. Nutrients, 2025, 17(12): 2019.
https://doi.org/10.3390/nu17122019
|
| [12] |
LIU H, JIAO J, ZHU M, et al. Nutritional Status According to the Short-Form Mini Nutritional Assessment (MNA-SF) and Clinical Characteristics as Predictors of Length of Stay, Mortality, and Readmissions Among Older Inpatients in China: A National Study [J]. Front Nutr, 2022, 9: 815578.
https://doi.org/10.3389/fnut.2022.815578
|
| [13] |
ARAI H, OUCHI Y, YOKODE M, et al. Toward the realization of a better aged society: messages from gerontology and geriatrics [J]. Geriatr Gerontol Int, 2012, 12(1): 16-22.
https://doi.org/10.1111/j.1447-0594.2011.00776.x
|
| [14] |
ZAMBONI M, MAZZALI G. Obesity in the elderly: an emerging health issue [J]. International Journal of Obesity, 2012, 36(9): 1151-2.
https://doi.org/10.1038/ijo.2012.120.
|
| [15] |
BESORA-MORENO M, LLAURADó E, TARRO L, et al. Social and Economic Factors and Malnutrition or the Risk of Malnutrition in the Elderly: A Systematic Review and Meta-Analysis of Observational Studies [J]. Nutrients, 2020, 12(3).
https://doi.org/10.3390/nu12030737
|
| [16] |
WU Y, WANG L, ZHU J, et al. Growing fast food consumption and obesity in Asia: Challenges and implications [J]. Social Science & Medicine, 2021, 269: 113601.
https://doi.org/10.1016/j.socscimed.2020.113601
|
| [17] |
POGGIOGALLE E, KIESSWETTER E, ROMANO M, et al. Psychosocial and cultural determinants of dietary intake in community-dwelling older adults: A Determinants of Diet and Physical Activity systematic literature review [J]. Nutrition, 2021, 85: 111131.
https://doi.org/10.1016/j.nut.2020.111131
|
| [18] |
RYAN D, BARQUERA S, BARATA CAVALCANTI O, et al. The Global Pandemic of Overweight and Obesity [M]//KICKBUSCH I, GANTEN D, MOETI M. Handbook of Global Health. Cham; Springer International Publishing. 2021: 739-73.
https://doi.org/10.1007/978-3-030-45009-0_39
|
Cite This Article
-
APA Style
Ke, Z., Ji, P., Zhao, Y., Lu, J., Luo, X., et al. (2025). Association Between Nutritional Scores and BMI Among Elderly in Shanghai Communities: A Community Health Survey. American Journal of Health Research, 13(6), 294-300. https://doi.org/10.11648/j.ajhr.20251306.11
 Copy
|
Copy
|
 Download
ACS Style
Ke, Z.; Ji, P.; Zhao, Y.; Lu, J.; Luo, X., et al. Association Between Nutritional Scores and BMI Among Elderly in Shanghai Communities: A Community Health Survey. Am. J. Health Res. 2025, 13(6), 294-300. doi: 10.11648/j.ajhr.20251306.11
Copy
|
Download
AMA Style
Ke Z, Ji P, Zhao Y, Lu J, Luo X, et al. Association Between Nutritional Scores and BMI Among Elderly in Shanghai Communities: A Community Health Survey. Am J Health Res. 2025;13(6):294-300. doi: 10.11648/j.ajhr.20251306.11
Copy
|
Download
-
@article{10.11648/j.ajhr.20251306.11,
  author = {Zhui Ke and Peng Ji and Yini Zhao and Jingyi Lu and Xinpei Luo and Xuemin He and Zhuqing Liu and Min Yuan and Xianling Guo and Qing Xu},
  title = {Association Between Nutritional Scores and BMI Among Elderly in Shanghai Communities: A Community Health Survey
},
  journal = {American Journal of Health Research},
  volume = {13},
  number = {6},
  pages = {294-300},
  doi = {10.11648/j.ajhr.20251306.11},
  url = {https://doi.org/10.11648/j.ajhr.20251306.11},
  eprint = {https://article.sciencepublishinggroup.com/pdf/10.11648.j.ajhr.20251306.11},
  abstract = {Background: Population aging intensifies the public health challenge of malnutrition among the elderly, who face both undernutrition and overnutrition. The relationship between BMI and nutritional status in urban Chinese elderly remains underexplored. Objective: This study aimed to examine the association between Body Mass Index (BMI) and Mini-Nutritional Assessment Short-Form (MNA-SF) scores among community-dwelling elderly in Shanghai. Methods: A cross-sectional survey was conducted from January 2019 to January 2023, involving 106 elderly residents aged ≥60 years. Data on demographics, BMI, and MNA-SF scores were collected. Statistical analyses included descriptive statistics, Pearson correlation, and simple linear regression. Results: The mean age was 70.89 ± 6.56 years, with 75.5% females. Mean BMI was 22.85 ± 3.13 kg/m²; 30.2% were overweight and 7.5% underweight. The mean MNA-SF score was 12.23 ± 1.50, with 29.2% at risk of malnutrition. A significant positive correlation was found between BMI and nutritional score (r = 0.504, p p < 0.001), with the equation: Nutritional Score = 6.679 + 0.243 × BMI (R² = 0.254). Conclusion: BMI is positively associated with nutritional scores among Shanghai community-dwelling elderly. However, reliance solely on BMI may overlook hidden malnutrition risks in overweight individuals. Community health strategies should integrate comprehensive nutritional assessments for targeted interventions.
},
 year = {2025}
}
Copy
|
Download
-
TY  - JOUR
T1  - Association Between Nutritional Scores and BMI Among Elderly in Shanghai Communities: A Community Health Survey

AU  - Zhui Ke
AU  - Peng Ji
AU  - Yini Zhao
AU  - Jingyi Lu
AU  - Xinpei Luo
AU  - Xuemin He
AU  - Zhuqing Liu
AU  - Min Yuan
AU  - Xianling Guo
AU  - Qing Xu
Y1  - 2025/11/22
PY  - 2025
N1  - https://doi.org/10.11648/j.ajhr.20251306.11
DO  - 10.11648/j.ajhr.20251306.11
T2  - American Journal of Health Research
JF  - American Journal of Health Research
JO  - American Journal of Health Research
SP  - 294
EP  - 300
PB  - Science Publishing Group
SN  - 2330-8796
UR  - https://doi.org/10.11648/j.ajhr.20251306.11
AB  - Background: Population aging intensifies the public health challenge of malnutrition among the elderly, who face both undernutrition and overnutrition. The relationship between BMI and nutritional status in urban Chinese elderly remains underexplored. Objective: This study aimed to examine the association between Body Mass Index (BMI) and Mini-Nutritional Assessment Short-Form (MNA-SF) scores among community-dwelling elderly in Shanghai. Methods: A cross-sectional survey was conducted from January 2019 to January 2023, involving 106 elderly residents aged ≥60 years. Data on demographics, BMI, and MNA-SF scores were collected. Statistical analyses included descriptive statistics, Pearson correlation, and simple linear regression. Results: The mean age was 70.89 ± 6.56 years, with 75.5% females. Mean BMI was 22.85 ± 3.13 kg/m²; 30.2% were overweight and 7.5% underweight. The mean MNA-SF score was 12.23 ± 1.50, with 29.2% at risk of malnutrition. A significant positive correlation was found between BMI and nutritional score (r = 0.504, p p < 0.001), with the equation: Nutritional Score = 6.679 + 0.243 × BMI (R² = 0.254). Conclusion: BMI is positively associated with nutritional scores among Shanghai community-dwelling elderly. However, reliance solely on BMI may overlook hidden malnutrition risks in overweight individuals. Community health strategies should integrate comprehensive nutritional assessments for targeted interventions.

VL  - 13
IS  - 6
ER  -
Copy
|
Download





 Share This Article
 Twitter
 Linked In
 Facebook