Research Article | | Peer-Reviewed

Cognitive Decline Trajectories and Their Determinants in Middle-aged and Elderly Chinese

Received: 17 March 2025     Accepted: 18 May 2025     Published: 11 June 2025
Views:       Downloads:
Abstract

Objective: This study examined trajectories of cognitive decline in a large nationally representative sample of middle-aged and elderly people in Chinese during 5 years of follow-up, then, explored the factors that influenced the cognitive function decline. Methods: Data from the China Health and Retirement Longitudinal Study cohort (CHARLS: 2011-2015), were analyzed. Totally, 2379 participants (aged 45 years or older) were included. The Latent Class Growth Analyses (LCGA) were used to identify the potential heterogeneity in longitudinal changes of cognitive function and BMI (Body Mass Index) over the past 5 years. And Logistic Regression models were used to explore the factors affecting cognitive decline. Results: The mean score of baseline cognitive function was 14.14 (SD = 1.33). Three trajectories of cognitive function were identified: High-Slow decline (54.1%), Moderate-stable (34.9%), and Moderate-Rapid decline (10.9%). Maintaining a High BMI, living in urban, having a high level of education, people who drink but less than once a month tends to be associated with better cognitive function, older people with depression are more likely to suffer from cognitive decline. Conclusions: Cognitive function was identified into three trajectories in the Chinese middle-aged and elderly population. BMI, place of residence, alcohol consumption, age and depression were found to be potential determinants of cognitive decline, and these factors, especially the modifiable risk factors, should be controlled in life to reduce the occurrence of cognitive decline.

Published in American Journal of Health Research (Volume 13, Issue 3)
DOI 10.11648/j.ajhr.20251303.16
Page(s) 168-177
Creative Commons

This is an Open Access article, distributed under the terms of the Creative Commons Attribution 4.0 International License (http://creativecommons.org/licenses/by/4.0/), which permits unrestricted use, distribution and reproduction in any medium or format, provided the original work is properly cited.

Copyright

Copyright © The Author(s), 2025. Published by Science Publishing Group

Keywords

Cognitive Function, LCGA, CHARLS

1. Introduction
Cognitive impairment is a major health problem in the aging population. With prevalence rates increasing year by year, and dementia have developed into major public health issues . Growing body of evidence is emerging with regard to predictors of cognitive decline in older age. The most commonly investigated being sociodemographic, health, depression and health behaviour factors .
Currently, the factors affecting cognitive decline in middle-aged and older adults remains controversial. Some studies reported that people with a low BMI may be at risk for cognitive impairment, whereas a high BMI could be a protective factor for cognitive impairment in older adulthood . It has also been reported that people over 65 with a high BMI are at increased risk of cognitive impairment and dementia . Besides, Lifestyle and diseases has also received increasing attention as a modifiable behaviour because this factor is relatively easily amendable with potential benefits for overall health as well as memory .
It has been proven that cognitive function changes both within and between individuals with increasing age. Therefore longitudinal repeated assessment of cognitive function is better than cross-sectional measures. Many prior studies used body mass index (BMI) measured at one point in time as the primary exposure. The use of a single, point exposure fails to capture any variation and longitudinal patterns in disease risk that may occur because of changes in exposure. Alternative approaches to study adiposity include using body weight as a time varying exposure with multiple measurement time points, examining weight change (i.e., difference between two measurement time points), and using trajectory modeling approaches to assess change over time . In recent studies, latent class growth models (LCGA) have been used to describe a variety of different cognitive function, BMI, or body size trajectories in older adults . The construction of LCGA models on BMI and cognitive function can determine that whether the trajectory of longitudinal BMI change over a long period of life plays a significant role in changes in cognitive function.
Based on the database of CHARLS (China Health and Retirement Longitudinal Study), this study classified cognitive function and BMI into different trajectories by constructing the LCGA model and investigated, and explored the factors affecting cognitive decline to prevent the development of cognitive impairment in the Chinese middle-aged and elderly population.
2. Methods
2.1. Study Population
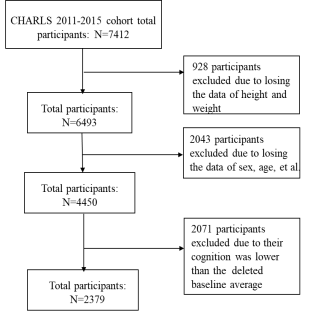
The CHARLS was a nationally representative study of Chinese adults aged ≥45, which began in 2011 and aimed to describe the health, health insurance, and economic status of middle-aged and older adults after retirement dynamically in China. The data for this study were obtained from the 2011 CHARLS baseline survey and subsequent follow-up data on weight and cognitive function in 2013, 2015. Details of the study design, sampling procedures, and data collection have been described in previous studies. In order to better investigate the influences associated with cognitive decline and to make the cognitive decline subgroup more distinct, we removed individuals who were below the baseline average, so that the LCGA subgroup would be more significant than the decline in the curve obtained by including all of them, thus making it more comparable. Individuals were included based on the following criteria: (1) Respondents who completed the cognitive assessment at baseline and all follow-up time points. (2) Respondents who provided data at baseline on gender, years of education, marital status, health insurance, chronic illness, sleep duration, physical and social activity, depression, height, and weight. (3) Baseline cognitive function scores were greater than the baseline population average. The detailed process for sample extraction was shown in Figure 1. Finally, 2,379 participants were included. Ethical approval for all CHARLS was obtained from the BHU Institutional Review Board. The IRB approval number for the main household survey including anthropometrics was IRB00001052-11, 015; the IRB approval number for the biomarker collection was IRB00001052-11, 014.
Figure 1. Flow chart of participant enrollment.
2.2. Assessment of Cognitive Function
Based on the HRS (Health and Retirement Study), CHARLS designed a composite battery of cognitive tests. The reliability and validity of the assessments have been demonstrated in previous studies. Cognitive function was measured at 3 time points—the CHARLS 2011 baseline and 2013, 2015 follow-up surveys—using questionnaires that were adapted from the Telephone Interview for Cognitive Status. According to the cognitive tests, 2 dimensions of cognitive function were captured: episodic memory and executive function. Episodic memory was measured by immediate recall and delayed recall (score range, 0-10 points). Executive function was evaluated by orientation, calculation, and visuospatial ability (score range, 0-11 points) .
2.3. Other Measurements
Weight and height were measured objectively by trained investigators using standardized equipment. BMI was calculated as weight (kg)/ [height (m)]2 . Physical activity is calculated by the formula: Volume of VPA/LPA/MPA=Frequency of VPA/LPA/MPA*Duration of VPA/LPA/MPA Therefore, the volume of MVPA was then coded as no MVPA OR not sufficient (≤600 MET)/ sufficient (600~2999MET)/ excessive (≥3000MET). Depression was measured with TICS (0–10). The following variables were included as covariates: age, sex (0=male, 1=female), marital status (0 = married, 1 = divorced/widowed/unmarried), place of residence (1=rural, 2=urban, 3=unified residence, dummy variable, reference group: rural), medical insurance (0 = no medical insurance, 1 = medical insurance), Physical activity(≤600MET-minutes/week, (600~2999)MET-minutes/week, ≥3000MET-minutes/week), Social Activities in one week (0=No, 1=Yes), Smoke (0=No, 1=Yes), Drink(0=No, 1= drink but less than once a month, 2= drink more than once a month), chronic diseases (0 = no chronic diseases, 1 = 1 kinds of chronic diseases, 2 = more than 2 diseases), sleep duration, an education level (1 = illiterate, 2 = junior high school and below, 3 = high/vocational school, 4 = college and above, dummy variable, reference group: illiterate).
2.4. Statistical Analysis
Latent Class Growth Analysis (LCGA) models were used to identify different cognitive trajectories and BMI trajectories. In this study, trajectories were constructed by Mplus software, a process that started by specifying a level 1 LCGA model and then increasing the number of classes and comparing the fit of each model. The optimal number of groups was selected using a combination of the Akira Pool Information Criterion (AIC), Bayesian Information Criterion (BIC), Adjusted BIC (aBIC), Entropy, LMR-LRT, and BLRT test results. In addition, the proportion of each category was not less than 5% of the sample size, and the posterior probability of correctly assigning the study population to each category needed to be >0.80 . Statistical analyses were performed using IBM SPSS Statistics 26.0, with continuous variables expressed as means (SD) and categorical variable tables expressed as percentages. A χ2 test or ANOVA was used to compare whether the variables differed between trajectory groups. Logistic models were used to analyze the factors affecting cognitive decline, and results were considered significant when p<0.05.
3. Results
3.1. Characteristics of the Participants
The average age of the participants was 67.33 years (SD = 7.81), the mean annual cognitive function score was [14.14 (SD = 1.33), 12.92(2.57), 12.64(2.63)] and the mean annual BMI was [24.02 kg/m2 (SD = 3.50), 24.30 kg/m2 (SD = 3.55), 24.18 kg/m2 (SD = 3.61)]. In baseline, among the participants, 55.95% were male. 81.50% of the participants had only less than nine years of compulsory education; 93.15% of the participants were married; 74.44% of the participants had a rural residence, most participants (95.50%) had health insurance, 66.08% of the participants had less than two chronic illnesses. 58.50% of the participants have social activities in one week, 75.58% participants lack of physical activities, 56.49% participants never smoke and 62.23% participants never drink. The average sleeping time is 6.55 h (SD = 1.62) and the average depression scores is 6.71(SD = 5.54).
3.2. Results of the LCGA Model
3.2.1. Trajectory Model of Cognitive Function
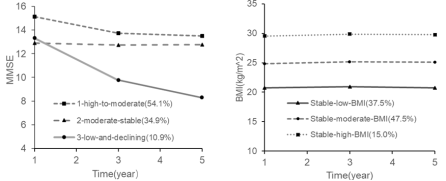
In the LCGA model, there were groups where the proportion of people included in the trajectory was less than 5% of the sample size when they were divided into five groups (Table 1), and the posterior probability of a category was <0.80 when they were divided into four groups (Supplementary Table 1, Supplementary Table 2). Finally, the trajectories were divided into 3 groups. The trends of three trajectories groups were as follows (see Figure 2): (1) High-Slow decline group [Intercept: 15.56 (p<0.001), Slope: -0.449 (p<0.001)]: a group with cognitive function score that declined slowly (54.1%) from high levels. (2) Moderate-Stable group [Intercept: 12.95 (p<0.001), Slope:-0.040(p=0.328)]: cognitive function score remained moderate over the three stages (34.9%). (3) Moderate-Rapid decline group [Intercept: 14.61 (p<0.001), Slope: -1.33 (p<0.001)]: cognitive function score declined rapidly (10.9%). Estimated means and estimated individuals values see in Supplementary Figure 1.
Figure 2. Trajectories of cognitive function and BMI over 5 years of follow-up by LCGA.
Table 1. Fit statistics for the LCGA of cognitive function trajectories and BMI trajectories.

Characteristic

class

AICa

BICb

aBICc

Entropy

LMRT

BLRT

proportion

Cognitive function

1

30769.01

30797.88

30797.88

2

30053.27

30099.46

30074.04

0.715

<0.001

<0.001

21.5/78.5

3

29797.79

29861.30

29826.35

0.735

<0.001

<0.001

34.9/10.9/54.1

4

29635.51

29716.35

29671.87

0.740

<0.001

<0.001

44.6/34.38/12.0/9.0

5

29493.69

29591.85

29537.84

0.748

0.024

<0.001

24.4/16.86/38.2/17.0/3.6

BMI

1

38356.35

38385.22

38369.33

2

34964.28

35010.48

34985.06

0.827

<0.001

<0.001

58.7/41.3

3

33008.41

3371.93

33036.98

0.874

<0.001

<0.001

47.5/15.0/37.5

4

32054.59

32135.43

32090.95

0.863

0.076

<0.001

39.6/27.8/25.5/6.8

Class: number of trajectories; AIC: Akaike information criterion. BIC: Bayesian information criterion. aBIC: Sample-size adjusted BIC. LMRT: Lo, Mendell and Rubin adjusted LRT; BLRT: Bootstrap LRT. Proportion: trajectory membership proportions; The bold text indicates the model that was selected as having the optimal number or classes.
Table 2. Characteristics between Trajectory Groups of Cognitive functiona.

CHARACTERISTIC

High-Slow decline

Moderate-Stable

Moderate-Rapid decline

TOTAL (n = 2379)

Pb

(n = 1288)

(n = 831)

(n=260)

BMI Trajectory Group

0.001

Stable-low-BMI

455(35.3)

312(37.5)

124(47.7)

891(37.5)

Stable-moderate-BMI

617(47.9)

407(49.0)

106(40.8)

1130(47.5)

Stable-high-BMI

216(16.8)

112(13.5)

30(11.5)

358(15.0)

Agec mean (SD)

66.6 (7.8)

67.8(7.9)

69.5(7.8)

67.3(7.8)

<0.001

Place of residence

rural

874(67.8)

661(79.5)

237 (91.2)

1771(74.4)

<0.001

urban

405(31.4)

167 (20.1)

21(8.1)

593(24.9)

unified residence

10(0.8)

2(0.2)

2 (0.8)

14(0.6)

Gender

Male

743(57.6)

455(54.8)

134(51.7)

1332(56.0)

0.151

Female

546(42.4)

376(45.2)

12(48.3)

1047(44.0)

Insurance

Urban employee medical insurance

1232(95.7)

797(95.9)

243(93.5)

2272(95.5)

0. 234

Urban resident medical insurance

56(4.3)

34(4.1)

17(6.5)

107(4.5)

Education

No formal education illiterate

184(14.3)

214(25.8)

115(44.2)

513(21.6)

<0.001

Elementary /Middle school

796(61.8)

500(60.2)

130(50.0)

1426(59.9)

High/Vocational School

260(20.2)

101(12.2)

14(5.4)

375(15.8)

College degree or above

48(3.7)

16(1.9)

1(1.5)

65(2.7)

Marriage

Married

1210(93.9)

770(92.7)

236(90.8)

2216(93.1)

0.143

Divorced / Widowed/ Never married

78(6.1)

61(7.3)

24(9.2)

163(6.9)

Number of Chronic diseases

None

500(38.8)

267(32.1)

89(34.2)

856(36.0)

1

374(29.0)

266(32.0)

77 (29.6)

716(30.1)

0.033

> 2

415(32.2)

298(35.9)

94(36.2)

807(33.9)

Social Activities in one week

No

495(38.4)

366(44.0)

127(48.8)

988(41.5)

0.002

Yes

793(61.6)

465(56.0)

133(51.2)

1391(58.5)

Physical activities

≤600MET-minutes/week

997(77.4)

605(72.8)

196(75.4)

1798(75.6)

0.151

(600~2999)MET-minutes/week

260(20.2)

196(23.6)

57(21.9)

513(216)

≥3000 MET-minutes/week

31(2.4)

30(3.6)

7(2.7)

68(2.9)

Smoke

No

740(57.5)

457(55.0)

147(43.5)

1344(56.5)

0.537

Yes

548(42.5)

374(45.0)

113(43.5)

1035(43.5)

Drink

No

776(60.2)

527(63.4)

178(68.5)

1481(62.3)

0.003

Drink but less than once a month

144(11.2)

72(8.7)

10(3.8)

226(9.5)

Drink more than once a month

388(28.6)

232(27.9)

72(27.7)

672(28.2)

TICS (0–10), mean (SD)c

5.8(5.0)

7.5(5.9)

8.7(6.1)

6.7(5.5)

<0.001

Sleeping-time, mean (SD)c

6.6(1.5)

6.5(1.6)

6.2(2.0)

6.6(1.6)

0.002

a Data are presented as counts (percentage) unless otherwise indicated.
b P value determined using χ2 test or analysis of variance F-test.
c For continuous variables, mean (SD) for each trajectory group and significance from analysis of variance F-test are reported.
3.2.2. Trajectory Model of BMI
LMRT test P>0.05 when divided them into 4 groups. Finally, the BMI trajectories were grouped into three groups by comprehensive consideration (Table 1), in which all posterior probabilities are greater than 0.9 (see Supplementary Table 2). The trajectory plots (Figure 2): (1) Stable-moderate-BMI (47.5%) [Intercept: 24.85 (p<0.001), Slope: 0.059 (p<0.001)], the average of the three follow-up time points was (24.84, 25.16, 25.07) kg/m2 (2) Stable-high-BMI (15.0%) [Intercept: 29.54 (p<0.001), Slope: 0.061 (p=0.019)], the average of the three follow-up time points was (29.53, 29.85, 29.77) kg/m2. (3) Stable-low-BMI (37.5%) [Intercept: 20.78 (p<0.001), Slope: 0.009 (p=0.498)], the average of the three follow-up time points was (20.73, 20.93, 20.76) kg/m2. Estimated means and estimated individuals values see in Supplementary Figure 2.
3.3. Trajectory Characterization
There were significant differences among age, place of residence, education, number of chronic diseases, social activities in one week, drink, depression and sleep duration in the three trajectories of cognitive function. Middle-aged and older adults who had low BMI, high age, low education level, have no social activities in one week, drink, have depression problem, a higher number of chronic diseases, rural residence, and less sleep duration had a higher probability of appearing in the Moderate-Rapid decline group, P<0.05, as detailed in Table 2 for comparison among groups.
3.4. Logistic Regression Analysis Model
Compared with Moderate-Stable group: In the Moderate-Rapid decline group, Stable-moderate-BMI group (odds ratio [OR], 0.655; 95% confidence intervals [CI], 0.486 to 0.833), urban (OR, 0.421; 95% CI, 0.272 to 0.653), elementary/middle school (OR, 0.484; 95% CI, 0.359 to 0.652), high/vocational School (OR, 0.258; 95% CI, 0.141 to 0.471), college degree or above (OR, 0.116; 95% CI, 0.015 to 0.888) and drink but less than once a month (OR, 0.448; 95% CI, 0.220 to 0.912) preventing cognitive function decline, age (OR, 1.029; 95% CI, 1.011 to 1.047) and depression (OR, 1.032; 95% CI, 1.009 to 1.056) had a risk effect on cognitive function; In the High-Slow decline group, the stable-high-BMI group (OR,1.322; 95% CI, 1.010 to 1.732), place of residence(OR, 1.792; 95% CI, 1.472 to 2.193), elementary/middle school (OR, 1.852; 95% CI, 1.476 to 2.322), high/vocational School(OR, 2.994; 95% CI, 2.212 to 4.052), college degree or above (OR, 3.489; 95% CI, 1.917 to 6.352), social activities in one week(OR, 1.261; 95% CI, 1.056 to 1.505), age (OR, 0.981; 95% CI, 0.970 to 0.992), 1 of chronic disease(OR, 0.749; 95% CI, 0.603 to 0.930), more than 2 of chronic disease (OR, 0.744; 95% CI, 0.603 to 0.918), physical activities>600MET-minutes/week (OR, 0.781; 95% CI, 0.639 to 0.955), depression (OR, 0.942; 95% CI, 0.927 to 0.958) were significantly different (Table 3 for detail).
Table 3. Factors associated with trajectories of MMSE scores.

Adjustment

Moderate-Rapid decline group1

High-Slow decline group 1

OR

95%CI

P

OR

95%CI

P

BMI trajectory group

Stable-low-BMI

1

1

Stable-moderate-BMI

0.655

0.486,0.883

0.005

1.040

0.859,1.258

0.691

Stable-high-BMI

0.674

0.428,1.061

0.088

1.322

1.010,1.732

0.042

Age

1.029

1.011,1.047

0.002

0.981

0.970,0.992

0.001

Place of residence

rural

1

urbal

0.421

0.272,0.653

<0.001

1.792

1.472,2.193

<0.001

Gender

Male

1

1

Female

1.129

0.854,1.493

0.395

0.890

0.747,1.061

0.196

Insurance

Urban employee medical insurance

1

1

Urban resident medical insurance

1.640

0.900,2.987

0.106

1.066

0.689,1.647

0.775

Education

No formal education illiterate

1

1

Elementary/Middle school

0.484

0.359,0.652

<0.001

1.852

1.476,2.322

<0.001

High/Vocational School

0.258

0.141,0.471

<0.001

2.994

2.212,4.052

<0.001

College degree or above

0.116

0.015,0.888

0.038

3.489

1.917,6.352

<0.001

Marriage

Married

1

1

Divorced/Widowed/Never married

1.284

0.783,2.104

0.322

0.814

0.575,1.151

0.244

Number of chronic diseases

None

1

1

1

0.868

0.613,1.231

0.428

0.749

0.603,0.930

0.009

2

0.946

0.678,1.321

0.746

0.744

0.603,0.918

0.006

Social activities in one week

No

1

1

Yes

0.824

0.624,1.090

0.175

1.261

1.056,1.505

0.010

Physical activities

≤600MET-minutes/week

1

1

(600~2999)MET-minutes/week

0.898

0.641,1.256

0.529

0.818

0.650,1.029

0.086

≥3000 MET-minutes/week

0.720

0.311,1.66

0.443

0.696

0.495,0.978

0.037

Smoke

No

Yes

1.065

0.804,1.410

0.662

1.105

0.927,1.317

0.265

Drink

No

1

Drink but less than once a month

0.448

0.220,0.912

0.027

1.261

0.909,1.749

0.165

Drink more than once a month

1.088

0.795,1.490

0.598

0.928

0.761,1.132

0.462

TICS (0–10)

1.032

1.009,1.056

0.007

0.942

0.927,0.958

<0.001

Sleeping-time

0.907

0.837,0.984

0.018

1.039

0.983,1.099

0.175

Reference: Moderate-Stable group
4. Discussion
This study collected a nationally representative data of 2379 middle-aged and elderly Chinese from the CHARLS database. The LCGA model divided cognitive function and BMI into three trajectory groups, subsequent logistic regression analysis showed that high BMI, living in urban, having a high level of education, drink but less than once a month preventing cognitive function decline, older people with depression are more likely to suffer from cognitive decline.
Both changes in cognitive function and BMI were identified into three trajectories. A study based on four waves of data from the China Longitudinal Healthy Longevity Survey (CLHLS) identified cognitive function of older people into three trajectory groups with LCGA: stable cognitive group (SCG), high initial level-cognitive decline group (HIL-CDG), and high initial level-cognitive decline group (LIL-CDG) . Also, a study on cognitive function of adults in Zaragoza, Spain, obtained 3 distinct trajectories with the best-fitting age-adjusted model: 1-high-to-moderate (21.2% of participants), 2-moderate-stable (67.5%) and, 3-low-and-declining (9.9%) cognitive function over time . This study identified three unique trajectories of BMI over 5 years. In a study on BMI and cognitive function in Israel, BMI trajectories were identified into three groups, corresponding to "normal" (between 18.5 and 24.99 kg/m2; 46%), overweight (between 25 and 29.99 kg/m2; 43.6%) or obese (>30%; 10.3% kg /m2), which is generally consistent with the classification of longitudinal changes in BMI in this study.
In the compared Moderate-Stable group and Moderate-Rapid decline group, we found that high BMI, live in urban, have a high level of education, drink but less than once a month preventing cognitive function decline, older people with depression are more likely to suffer from cognitive decline. Since the cognitive function scores were similar in these groups at baseline, they were more comparable. These factors have been confirmed in previous studies: Martin Lövdén et al., observed the number of years of formal education completed by individuals is positively correlated with their cognitive function throughout adulthood and predicts lower risk of dementia late in life. An Indonesian cross-sectional study showed that obesity in elderly individuals is less associated with cognitive impairment . The above results were consistent with our findings. Hanzhang Xu et al., observed urban residents and urban-to-urban migrants had the highest levels of cognitive function, whereas rural residents and those who migrated to (or within) rural areas had the lowest cognitive function. In several longitudinal studies, light-to-moderate drinking of alcoholic beverages has been proposed as being protective against the development of age-related changes in cognitive function. Wentao Huang et al., suggest that depressive symptoms were associated with lower cognitive performance and larger subsequent decline during follow-up period.
In the compared Moderate-Stable group and High-Slow decline group, we found that the cognitive function scores for High-Slow decline group were higher than those for Moderate-Stable group even at the end of follow-up. Thus, even though the MMSE scores for High-Slow decline group decreased, overall cognitive function was still better than for Moderate-Stable. Individuals with high BMI, older, urban living, a higher level of education, drinking but less than once a month, social activities in one week, depression were more likely to appear in High-Slow decline group, individuals with physical activities more than 3000MET-minutes/week and chronic disease were more likely to appear in Moderate-Stable decline group. Lower social activity, higher physical activities and chronic disease may be the main reasons for the lower baseline levels in the moderately stable group rather than for the rapid decline in cognitive function. In a study on the relationship between social and intellectual activity and cognitive trajectories in middle-aged and older Chinese people: more frequent intellectual activities (OR 0.54, 95% CI 0.38–0.77) and social activities (OR 0.79, 95% CI 0.65–0.95) were both associated with a lower likelihood of being in the “persistently low trajectory” for global cognitive function. A 12-year follow-up of cognitive function and its determinants in a longitudinal survey of healthy longevity in older people in China came to a similar conclusion to ours: leisure activity was not associated with rapid decline in cognitive function. In a cross-sectional study on physical activity and its association with cognitive function in middle- and older-aged Chinese, it was concluded that compared with those who had no VPA, those who spent 6–7 days/week (β = −0.59, 95% CI: −1.10, −0.09) or more than 240 min/each time on VPA had poorer cognitive function among rural respondents. A Cross-sectional structural equation model found that more depressive symptoms and chronic conditions, the worse the cognitive performance. While, in longitudinal trajectory studies on cognitive function, the heart failure literature reports stable trajectory of change in attention, executive function and processing speed over 6 months to 1 year. Cognitive function was stable for 3 years in people with chronic obstructive pulmonary disease.
Conventional growth model approaches such as the multilevel, random-effects model, assumes that the growth trajectories of all individuals can be adequately described with a single estimate of growth parameters. LCGA models relax this assumption and allow for differences in growth parameters across unobserved subpopulations using latent trajectory classes. LCGA model is increasingly recognized because of its excellent performance in identifying homogeneous subgroups of heterogeneous populations and the meaningful groups or individual classes. LCGA trajectory modeling can assess trends in cognitive function and BMI over time for different individuals during follow-up. Based on the epidemiological theory of the life course, exposures during specific life periods can greatly influence the development of diseases in later life.
The present study has several strength: (1) It followed a relatively large nationally representative cohort of Chinese middle-aged and older adults and provided a complete assessment of cognitive function. (2) In this study, the trajectory model (LCGA) was used to assess cognitive aging trajectories, which helped to identify individuals with similar changes in cognitive function over time. (3) Efforts were made in this study to mitigate the impact of unstable BMI on the results, in order to reduce bias. It has been suggested that at an older age, the stability of BMI may confer protection against cognitive decline, irrespective of the initial BMI of the individual. This study divided BMI into three stable trajectories, thus avoided the impact of BMI changes on outcomes during follow-up and better investigated the impact of different levels of BMI on cognitive function.
The present study has several limitations: (1) First, the trajectory of those with severe cognitive impairment could not be observed due to the strict exclusion of those with low cognitive function at baseline. (2) No trajectory of BMI change was observed due to the small change in weight during old age combined with the short follow-up period. (3) Some covariates, such as socioeconomic status, were not included in the regression model due to the low response rate, such as gait speed. (4) Problems with trajectory grouping have hindered research into the factors that influence the slow decline in cognitive function.
5. Conclusions
Older adults with a high BMI, living in urban areas, having a high level of education, drinking alcohol less than once a month, and suffering from depression are more likely to experience a decline in cognitive function. In the comparison of different cognitive function trajectory groups, various factors related to depression and changes in cognitive function have been identified.
The LCGA model has demonstrated its advantages in this study for evaluating the trends of cognitive function and BMI over time. Moreover, the research sample is nationally representative, the model application is reasonable, and the handling of BMI effectively reduces bias.
For future research, it is advisable to include more older adults with poor cognitive function, extend the follow-up period to comprehensively observe the change trajectories of BMI. At the same time, it is necessary to further improve the consideration of covariates such as socioeconomic status, and conduct in-depth exploration of the relationship between cognitive function and BMI as well as the influencing factors, so as to provide a more comprehensive basis for interventions aimed at promoting the cognitive health of the elderly.
Acknowledgments
We would like to acknowledge the China Health and Retirement Longitudinal Study cohort (CHARLS) database for providing the dataset for analysis.
Ethics Statement
The data that support the findings of this study are available from CHARLS but restrictions apply to the availability of these data, which were used under license for the current study, and so are not publicly available. Data are however available from the authors upon reasonable request and with permission of CHARLS.
Author Contributions
CYK and ZGP and LL designed the study, analyzed and interpreted data. XKY, LJX, RZW, BBW, and MD interpreted data. All authors critically revised and approved the manuscript.
Funding
The Key Research Project for Colleges and Universities in Henan Province, Grant/Award Number: 23B330005.
Data Availability Statement
The dataset supporting the conclusions of this study is available in the CHARLS database.
Conflicts of Interest
The authors have no conflicts to report.
References
[1] FERRI C P, PRINCE M, BRAYNE C, et al. Global prevalence of dementia: a Delphi consensus study [J]. Lancet (London, England), 2005, 366(9503): 2112-7.
[2] PRICKETT C, BRENNAN L, STOLWYK R. Examining the relationship between obesity and cognitive function: a systematic literature review [J]. Obesity research & clinical practice, 2015, 9(2): 93-113.
[3] ZANINOTTO P, BATTY G D, ALLERHAND M, et al. Cognitive function trajectories and their determinants in older people: 8 years of follow-up in the English Longitudinal Study of Ageing [J]. J Epidemiol Community Health, 2018, 72(8): 685-94.
[4] KIM G, CHOI S, LYU J. Body mass index and trajectories of cognitive decline among older Korean adults [J]. Aging & mental health, 2020, 24(5): 758-64.
[5] TANG X, ZHAO W, LU M, et al. Relationship between Central Obesity and the incidence of Cognitive Impairment and Dementia from Cohort Studies Involving 5,060,687 Participants [J]. Neuroscience and biobehavioral reviews, 2021, 130: 301-13.
[6] JIA J, ZHAO T, LIU Z, et al. Association between healthy lifestyle and memory decline in older adults: 10 year, population based, prospective cohort study [J]. Bmj, 2023, 380: e072691.
[7] LUO L, XIE F, WANG Y, et al. Taller adult height is associated with better performance of cognitive trajectories in Chinese over 45 years old: Evidence from the China Health and Retirement Longitudinal Study [J]. Geriatrics & gerontology international, 2021, 21(8): 732-40.
[8] MOMTAZ Y A, HARON S A, HAMID T A, et al. Body Mass Index (BMI) and Cognitive Functions in Later Life [J]. Current Alzheimer research, 2018, 15(2): 195-200.
[9] BANACK H R, CHANG J, STEFANICK M L, et al. Relationship between BMI trajectories and cardiometabolic outcomes in postmenopausal women: a growth mixture modeling approach [J]. Ann Epidemiol, 2022, 72: 9-17.
[10] BERLIN K S, PARRA G R, WILLIAMS N A. An introduction to latent variable mixture modeling (part 2): longitudinal latent class growth analysis and growth mixture models [J]. Journal of pediatric psychology, 2014, 39(2): 188-203.
[11] ZHAO Y, HU Y, SMITH J P, et al. Cohort profile: the China Health and Retirement Longitudinal Study (CHARLS) [J]. International journal of epidemiology, 2014, 43(1): 61-8.
[12] HUANG Y, ZHANG S, SHEN J, et al. Association of plasma uric acid levels with cognitive function among non-hyperuricemia adults: A prospective study [J]. Clin Nutr, 2022, 41(3): 645-52.
[13] HUA J, DONG J, CHEN G C, et al. Trends in cognitive function before and after stroke in China [J]. BMC Med, 2023, 21(1): 204.
[14] ZHOU L, MA X, WANG W. Relationship between Cognitive Performance and Depressive Symptoms in Chinese Older Adults: The China Health and Retirement Longitudinal Study (CHARLS) [J]. Journal of affective disorders, 2021, 281: 454-8.
[15] LIN L, CAO B, CHEN W, et al. Association of Adverse Childhood Experiences and Social Isolation With Later-Life Cognitive Function Among Adults in China [J]. JAMA Netw Open, 2022, 5(11): e2241714.
[16] FOLSTEIN M F, FOLSTEIN S E, MCHUGH P R. "Mini-mental state". A practical method for grading the cognitive state of patients for the clinician [J]. Journal of psychiatric research, 1975, 12(3): 189-98.
[17] LIN L, WANG H H, LU C, et al. Adverse Childhood Experiences and Subsequent Chronic Diseases Among Middle-aged or Older Adults in China and Associations With Demographic and Socioeconomic Characteristics [J]. JAMA Netw Open, 2021, 4(10): e2130143.
[18] YIN X Y, ZHENG F P, ZHOU J Q, et al. Central obesity and metabolic risk factors in middle-aged Chinese [J]. Biomedical and environmental sciences: BES, 2014, 27(5): 343-52.
[19] MENEGHELLI A, COCCHI A, MELIANTE M, et al. Time-course of clinical symptoms in young people at ultra-high risk for transition to psychosis [J]. Early intervention in psychiatry, 2022, 16(6): 600-8.
[20] YU W, CHEN R, ZHANG M, et al. Cognitive decline trajectories and influencing factors in China: A non-normal growth mixture model analysis [J]. Archives of gerontology and geriatrics, 2021, 95: 104381.
[21] LOBO E, GRACIA-GARCíA P, LOBO A, et al. Differences in Trajectories and Predictive Factors of Cognition over Time in a Sample of Cognitively Healthy Adults, in Zaragoza, Spain [J]. International journal of environmental research and public health, 2021, 18(13).
[22] WEST R K, RAVONA-SPRINGER R, SHARVIT-GINON I, et al. Long-term trajectories and current BMI are associated with poorer cognitive functioning in middle-aged adults at high Alzheimer's disease risk [J]. Alzheimer's & dementia (Amsterdam, Netherlands), 2021, 13(1): e12247.
[23] ANJUM I, FAYYAZ M, WAJID A, et al. Does Obesity Increase the Risk of Dementia: A Literature Review [J]. Cureus, 2018, 10(5): e2660.
[24] VIDYANTI A N, HARDHANTYO M, WIRATAMA B S, et al. Obesity Is Less Frequently Associated with Cognitive Impairment in Elderly Individuals: A Cross-Sectional Study in Yogyakarta, Indonesia [J]. Nutrients, 2020, 12(2).
[25] XU H, OSTBYE T, VORDERSTRASSE A A, et al. Place of Residence and Cognitive Function among the Adult Population in India [J]. Neuroepidemiology, 2018, 50(3-4): 119-27.
[26] PANZA F, FRISARDI V, SERIPA D, et al. Alcohol consumption in mild cognitive impairment and dementia: harmful or neuroprotective? [J]. Int J Geriatr Psychiatry, 2012, 27(12): 1218-38.
[27] HUANG W, ZHU W, CHEN H, et al. Longitudinal association between depressive symptoms and cognitive decline among middle-aged and elderly population [J]. Journal of affective disorders, 2022, 303: 18-23.
[28] LI H, LI C, WANG A, et al. Associations between social and intellectual activities with cognitive trajectories in Chinese middle-aged and older adults: a nationally representative cohort study [J]. Alzheimer's research & therapy, 2020, 12(1): 115.
[29] TU L, LV X, YUAN C, et al. Trajectories of cognitive function and their determinants in older people: 12 years of follow-up in the Chinese Longitudinal Healthy Longevity Survey [J]. Int Psychogeriatr, 2020, 32(6): 765-75.
[30] ZHOU X, LIAO S, QI L, et al. Physical activity and its association with cognitive function in middle- and older-aged Chinese: Evidence from China Health and Retirement Longitudinal Study, 2015 [J]. Eur J Sport Sci, 2022, 22(6): 937-47.
[31] DE ARAUJO J A P, XAVIER É F M, RODRIGUES E D S, et al. Main and moderated effects of multimorbidity and depressive symptoms on cognition [J]. Braz J Psychiatry, 2022, 44(6): 644-9.
[32] ALOSCO M L, GARCIA S, SPITZNAGEL M B, et al. Cognitive performance in older adults with stable heart failure: longitudinal evidence for stability and improvement [J]. Neuropsychology, development, and cognition Section B, Aging, neuropsychology and cognition, 2014, 21(2): 239-56.
[33] PARK S K. Trajectories of change in cognitive function in people with chronic obstructive pulmonary disease [J]. J Clin Nurs, 2018, 27(7-8): 1529-42.
[34] JUNG T, WICKRAMA K A S. An Introduction to Latent Class Growth Analysis and Growth Mixture Modeling [J]. Social and Personality Psychology Compass, 2008, 2(1): 302-17.
[35] HERLE M, MICALI N, ABDULKADIR M, et al. Identifying typical trajectories in longitudinal data: modelling strategies and interpretations [J]. Eur J Epidemiol, 2020, 35(3): 205-22.
[36] BEERI M S, TIROSH A, LIN H M, et al. Stability in BMI over time is associated with a better cognitive trajectory in older adults [J]. Alzheimer's & dementia: the journal of the Alzheimer's Association, 2022, 18(11): 2131-9.
Cite This Article
  • APA Style

    Wu, B., Ku, C., Wang, R., Dai, M., Ping, Z., et al. (2025). Cognitive Decline Trajectories and Their Determinants in Middle-aged and Elderly Chinese. American Journal of Health Research, 13(3), 168-177. https://doi.org/10.11648/j.ajhr.20251303.16

    Copy | Download

    ACS Style

    Wu, B.; Ku, C.; Wang, R.; Dai, M.; Ping, Z., et al. Cognitive Decline Trajectories and Their Determinants in Middle-aged and Elderly Chinese. Am. J. Health Res. 2025, 13(3), 168-177. doi: 10.11648/j.ajhr.20251303.16

    Copy | Download

    AMA Style

    Wu B, Ku C, Wang R, Dai M, Ping Z, et al. Cognitive Decline Trajectories and Their Determinants in Middle-aged and Elderly Chinese. Am J Health Res. 2025;13(3):168-177. doi: 10.11648/j.ajhr.20251303.16

    Copy | Download

  • @article{10.11648/j.ajhr.20251303.16,
      author = {Bin-Bin Wu and Chao-Yue Ku and Rui-Zhe Wang and Man Dai and Zhi-Guang Ping and Li Liu},
      title = {Cognitive Decline Trajectories and Their Determinants in Middle-aged and Elderly Chinese
    },
      journal = {American Journal of Health Research},
      volume = {13},
      number = {3},
      pages = {168-177},
      doi = {10.11648/j.ajhr.20251303.16},
      url = {https://doi.org/10.11648/j.ajhr.20251303.16},
      eprint = {https://article.sciencepublishinggroup.com/pdf/10.11648.j.ajhr.20251303.16},
      abstract = {Objective: This study examined trajectories of cognitive decline in a large nationally representative sample of middle-aged and elderly people in Chinese during 5 years of follow-up, then, explored the factors that influenced the cognitive function decline. Methods: Data from the China Health and Retirement Longitudinal Study cohort (CHARLS: 2011-2015), were analyzed. Totally, 2379 participants (aged 45 years or older) were included. The Latent Class Growth Analyses (LCGA) were used to identify the potential heterogeneity in longitudinal changes of cognitive function and BMI (Body Mass Index) over the past 5 years. And Logistic Regression models were used to explore the factors affecting cognitive decline. Results: The mean score of baseline cognitive function was 14.14 (SD = 1.33). Three trajectories of cognitive function were identified: High-Slow decline (54.1%), Moderate-stable (34.9%), and Moderate-Rapid decline (10.9%). Maintaining a High BMI, living in urban, having a high level of education, people who drink but less than once a month tends to be associated with better cognitive function, older people with depression are more likely to suffer from cognitive decline. Conclusions: Cognitive function was identified into three trajectories in the Chinese middle-aged and elderly population. BMI, place of residence, alcohol consumption, age and depression were found to be potential determinants of cognitive decline, and these factors, especially the modifiable risk factors, should be controlled in life to reduce the occurrence of cognitive decline.
    },
     year = {2025}
    }
    

    Copy | Download

  • TY  - JOUR
    T1  - Cognitive Decline Trajectories and Their Determinants in Middle-aged and Elderly Chinese
    
    AU  - Bin-Bin Wu
    AU  - Chao-Yue Ku
    AU  - Rui-Zhe Wang
    AU  - Man Dai
    AU  - Zhi-Guang Ping
    AU  - Li Liu
    Y1  - 2025/06/11
    PY  - 2025
    N1  - https://doi.org/10.11648/j.ajhr.20251303.16
    DO  - 10.11648/j.ajhr.20251303.16
    T2  - American Journal of Health Research
    JF  - American Journal of Health Research
    JO  - American Journal of Health Research
    SP  - 168
    EP  - 177
    PB  - Science Publishing Group
    SN  - 2330-8796
    UR  - https://doi.org/10.11648/j.ajhr.20251303.16
    AB  - Objective: This study examined trajectories of cognitive decline in a large nationally representative sample of middle-aged and elderly people in Chinese during 5 years of follow-up, then, explored the factors that influenced the cognitive function decline. Methods: Data from the China Health and Retirement Longitudinal Study cohort (CHARLS: 2011-2015), were analyzed. Totally, 2379 participants (aged 45 years or older) were included. The Latent Class Growth Analyses (LCGA) were used to identify the potential heterogeneity in longitudinal changes of cognitive function and BMI (Body Mass Index) over the past 5 years. And Logistic Regression models were used to explore the factors affecting cognitive decline. Results: The mean score of baseline cognitive function was 14.14 (SD = 1.33). Three trajectories of cognitive function were identified: High-Slow decline (54.1%), Moderate-stable (34.9%), and Moderate-Rapid decline (10.9%). Maintaining a High BMI, living in urban, having a high level of education, people who drink but less than once a month tends to be associated with better cognitive function, older people with depression are more likely to suffer from cognitive decline. Conclusions: Cognitive function was identified into three trajectories in the Chinese middle-aged and elderly population. BMI, place of residence, alcohol consumption, age and depression were found to be potential determinants of cognitive decline, and these factors, especially the modifiable risk factors, should be controlled in life to reduce the occurrence of cognitive decline.
    
    VL  - 13
    IS  - 3
    ER  - 

    Copy | Download

Author Information
  • Department of Health Statistics, College of Public Health, Zhengzhou University, Zhengzhou, China

  • Department of Health Statistics, College of Public Health, Zhengzhou University, Zhengzhou, China

  • Department of Health Statistics, College of Public Health, Zhengzhou University, Zhengzhou, China

  • Department of Health Statistics, College of Public Health, Zhengzhou University, Zhengzhou, China

  • Department of Health Statistics, College of Public Health, Zhengzhou University, Zhengzhou, China

  • School of Basic Medical Sciences, Zhengzhou University, Zhengzhou, China